


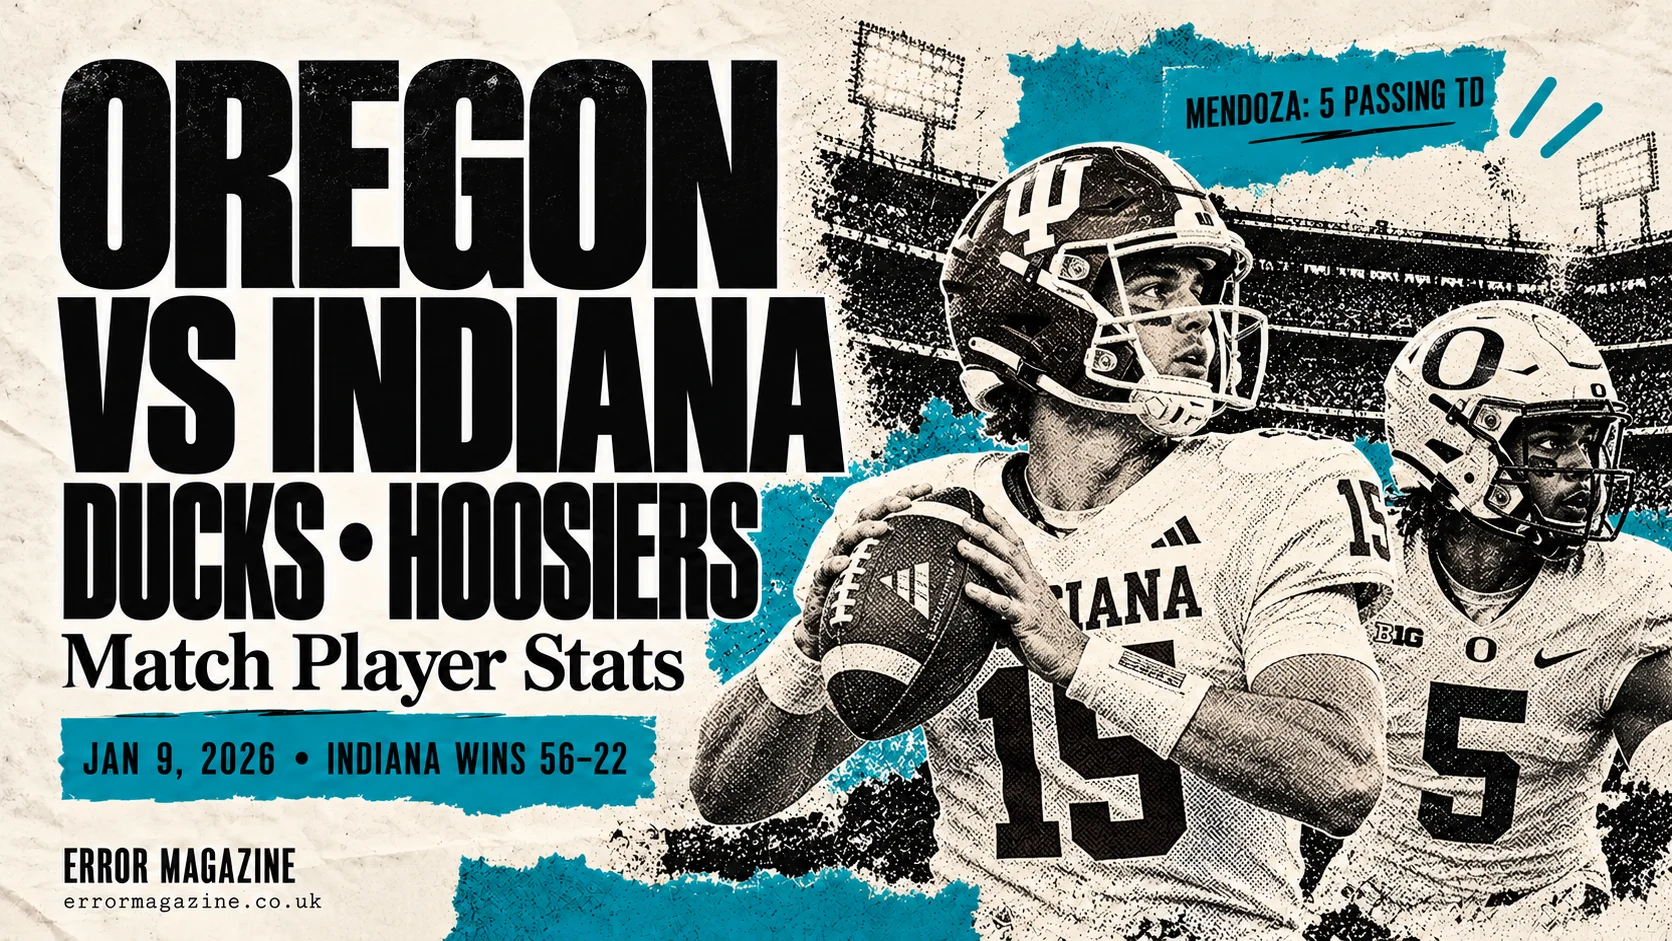

Indiana defeated Oregon 56–22 on January 9, 2026, at Mercedes-Benz Stadium in Atlanta, Georgia, in the College Football Playoff semifinal at the Chick-fil-A Peach Bowl. The game belonged to the 2025 college football season, despite taking place in January 2026.
For readers searching for Oregon Ducks football vs Indiana Hoosiers football match player stats, this is the most recent completed official meeting verified through the teams’ records. Fernando Mendoza led Indiana with five touchdown passes, while Dante Moore threw for 285 yards for Oregon but committed three costly turnovers.
The result presented an unusual statistical contrast: Oregon finished with more offensive yards, yet Indiana won by 34 points. Defensive scoring, short fields and efficient finishing explain the difference far better than yardage alone.
All statistics below refer exclusively to this Peach Bowl meeting, using the official team box scores and College Football Playoff game records.
Final Score: Indiana Took Control Before Halftime
| Team | First quarter | Second quarter | Third quarter | Fourth quarter | Final |
|---|---|---|---|---|---|
| Oregon Ducks | 7 | 0 | 8 | 7 | 22 |
| Indiana Hoosiers | 14 | 21 | 7 | 14 | 56 |
Oregon briefly recovered from a disastrous opening when Moore found Jamari Johnson for a touchdown to tie the score at 7–7. Indiana then scored the next 35 points, building a 42–7 advantage during the third quarter.
The decisive separation came in the second period. Indiana scored three touchdowns while holding Oregon scoreless, turning a competitive opening quarter into a 35–7 halftime lead.
That sequence shaped the rest of the contest. Oregon had to chase points, while Indiana could combine its running game with selective, accurate passing.
Quarterback Stats: Mendoza’s Efficiency Outweighed Moore’s Yardage
| Quarterback | Team | Completions–attempts | Passing yards | TD | INT | Times sacked |
|---|---|---|---|---|---|---|
| Fernando Mendoza | Indiana | 17–20 | 177 | 5 | 0 | 1 |
| Dante Moore | Oregon | 24–39 | 285 | 2 | 1 | 3 |
Statistical clarification: Oregon’s team passing line shows 40 attempts because the official box score assigns one additional incomplete attempt to the team. Moore’s individual total was 39.
Fernando Mendoza made limited passing volume count
Mendoza completed 85% of his passes, delivering five touchdowns on just 20 attempts. His scoring throws went to four receivers, with Elijah Sarratt catching two.
The performance illustrates why passing yards require context. Indiana did not need a high-volume aerial attack to dominate. Its defense repeatedly improved field position, and Mendoza converted those opportunities into touchdowns.
He also avoided an interception. Against an Oregon offense that lost possession three times, protecting the ball strengthened Indiana’s advantage.
The College Football Playoff named Mendoza the game’s offensive player of the game. Indiana’s postgame notes also confirmed that his five touchdown passes established a program bowl record.
Dante Moore produced yards but lost the possession battle
Moore completed 24 passes and finished with 108 more passing yards than Mendoza. His touchdown throws went to Johnson and Roger Saleapaga.
However, his interception became an immediate Indiana touchdown, and two lost fumbles created further scoring opportunities for the Hoosiers.
Those mistakes carried different consequences from an ordinary incomplete pass. They either put points directly on the scoreboard or left Indiana with very little field to cover.
Moore’s final numbers therefore show both sides of Oregon’s offensive performance: enough passing production to move the ball, but insufficient ball security to remain competitive.
Rushing Stats: Black Finished Drives, Hill Supplied Oregon’s Biggest Run
| Player | Team | Carries | Net rushing yards | Average | TD | Longest |
|---|---|---|---|---|---|---|
| Kaelon Black | Indiana | 12 | 63 | 5.2 | 2 | 23 |
| Roman Hemby | Indiana | 17 | 53 | 3.1 | 0 | 12 |
| Khobie Martin | Indiana | 4 | 42 | 10.5 | 0 | 26 |
| Fernando Mendoza | Indiana | 6 | 28 | 4.7 | 0 | 21 |
| Dierre Hill Jr. | Oregon | 5 | 86 | 17.2 | 0 | 71 |
| Jay Harris | Oregon | 16 | 35 | 2.2 | 1 | 7 |
| Dante Moore | Oregon | 5 | -28 | -5.6 | 0 | 6 |
Indiana also recorded one team rushing attempt for minus one yard, bringing its total to 185 yards on 40 attempts. Oregon finished with 93 yards on 26 attempts.
Indiana spread the workload
Black led the Hoosiers in rushing yards and scored both of their rushing touchdowns. His first came from one yard out; his second was a 23-yard fourth-quarter run.
Hemby carried more often, while Martin and Mendoza supplied additional gains. That distribution gave Indiana several ways to advance the ball without asking one runner to dominate the workload.
The Hoosiers’ rushing advantage also supported their control of the game. With a substantial lead, they could continue running while still threatening Oregon through Mendoza’s passing.
Hill’s average needs context
Hill produced Oregon’s most explosive rushing play, a 71-yard run that helped set up Harris’ third-quarter touchdown.
That carry accounted for most of his 86 rushing yards. Across his other four attempts, Hill gained a combined 15 yards.
His 17.2-yard average accurately captures his explosiveness, but it does not mean Oregon consistently generated long gains on the ground. Harris averaged 2.2 yards across 16 carries, and Moore’s negative rushing total further reduced the team figure.
College football includes sack losses in rushing statistics, which matters when interpreting Moore’s minus-28-yard line.
Receiving Stats: Sarratt Led Indiana, Johnson Paced Oregon
Indiana receiving
| Player | Receptions | Receiving yards | TD | Longest |
|---|---|---|---|---|
| Elijah Sarratt | 7 | 75 | 2 | 23 |
| Charlie Becker | 2 | 48 | 1 | 36 |
| Riley Nowakowski | 2 | 18 | 0 | 13 |
| Omar Cooper Jr. | 3 | 17 | 1 | 8 |
| E.J. Williams Jr. | 1 | 13 | 1 | 13 |
| D’Angelo Ponds | 1 | 6 | 0 | 6 |
| Roman Hemby | 1 | 0 | 0 | 0 |
| Total | 17 | 177 | 5 | 36 |
Sarratt provided Indiana’s largest receiving contribution, leading the team in catches, yards and receiving touchdowns.
Becker added a different threat. His 36-yard touchdown supplied Indiana’s longest completion and extended the lead to 28–7 in the second quarter.
Cooper and Williams each scored on shorter throws. Indiana’s distribution made the passing attack productive without requiring a large number of receptions from any single player.
Ponds also appeared on offense, catching a six-yard pass in addition to his much more consequential defensive contribution.
Oregon receiving
| Player | Receptions | Receiving yards | TD | Longest |
|---|---|---|---|---|
| Jamari Johnson | 4 | 83 | 1 | 39 |
| Jeremiah McClellan | 5 | 64 | 0 | 43 |
| Jay Harris | 3 | 32 | 0 | 15 |
| Kenyon Sadiq | 5 | 29 | 0 | 21 |
| Dakorien Moore | 2 | 28 | 0 | 15 |
| Dierre Hill Jr. | 2 | 25 | 0 | 13 |
| Malik Benson | 2 | 23 | 0 | 14 |
| Roger Saleapaga | 1 | 1 | 1 | 1 |
| Total | 24 | 285 | 2 | 43 |
Johnson led all players with 83 receiving yards. His 19-yard touchdown completed Oregon’s early response to Indiana’s opening defensive score.
McClellan and Sadiq shared Oregon’s team lead with five receptions each. McClellan also recorded the Ducks’ longest completion, a 43-yard gain.
Saleapaga caught Oregon’s final touchdown with 22 seconds remaining. That score contributed to Moore’s final passing totals, although the competitive outcome had already been decided.
Defensive Player Stats: Ponds and Ndukwe Changed the Game
Indiana’s most influential defensive contributions came through plays that ended Oregon possessions or directly created points.
| Player | Team | Key contribution |
|---|---|---|
| D’Angelo Ponds | Indiana | Six tackles and a 25-yard interception return for a touchdown |
| Aiden Fisher | Indiana | Team-leading nine tackles |
| Daniel Ndukwe | Indiana | Two sacks, a forced fumble and a blocked punt |
| Mario Landino | Indiana | Two fumble recoveries |
| Bryce Boettcher | Oregon | Team-leading 11 tackles |
Ponds intercepted Moore on Oregon’s first offensive snap and returned the ball for a touchdown. Indiana led 7–0 just 11 seconds into the game.
He later received defensive player of the game honors. His interception mattered beyond the immediate score: Oregon had to respond before Indiana’s offense had even taken the field.
Ndukwe influenced multiple phases. His pressure helped produce a lost fumble, and his fourth-quarter punt block handed Indiana another short scoring opportunity.
Landino recovered both of Moore’s lost fumbles. Boettcher’s 11 tackles led Oregon, but the Ducks did not generate a takeaway to offset Indiana’s possession advantage.
Read This :Dodgers vs Houston Astros Match Player Stats: Pages Hits Three Homers
Team Stats Explain the 34-Point Margin
| Category | Oregon | Indiana |
|---|---|---|
| Total offense | 378 yards | 362 yards |
| Offensive plays | 66 | 60 |
| Yards per play | 5.7 | 6.0 |
| Passing yards | 285 | 177 |
| Rushing yards | 93 | 185 |
| First downs | 20 | 18 |
| Third-down conversions | 8 of 13 | 11 of 14 |
| Fourth-down conversions | 0 of 2 | 0 of 0 |
| Turnovers committed | 3 | 0 |
| Possession time | 28:47 | 31:13 |
Oregon’s 16-yard advantage in total offense did not translate into control.
Indiana scored one touchdown without using its offense at all. Two other touchdown drives covered only three and 21 yards after fumble recoveries. A blocked punt later set up a seven-yard touchdown drive.
Short fields reduce the yardage an offense needs to score. That helps explain how Indiana could finish behind Oregon in total offense while comfortably winning the game.
Third-down execution provided another distinction. Indiana converted 11 of 14 opportunities, approximately 78.6%. Oregon also performed well at 8 of 13, but failed on both fourth-down attempts.
The Hoosiers combined possession security with efficient finishing. Oregon’s offensive gains could not compensate for the opportunities it surrendered.
Where the Contest Changed
Oregon answered the opening interception
The Ducks responded to Ponds’ touchdown with a 14-play, 75-yard scoring drive. Johnson’s touchdown reception tied the game and showed that Oregon could move the ball against Indiana.
At that stage, the opening mistake had not settled the contest.
Indiana separated in the second quarter
Mendoza’s eight-yard touchdown pass to Cooper restored Indiana’s lead before the first quarter ended.
The Hoosiers then added Black’s short rushing touchdown, Becker’s 36-yard reception and Sarratt’s two-yard scoring catch during the second quarter.
The combination of turnovers and touchdown conversions created the decisive halftime gap. Oregon needed both defensive stops and sustained scoring after the break.
The second half offered no sustained recovery
Indiana opened the third-quarter scoring with Mendoza’s 13-yard touchdown pass to Williams.
Hill’s long run and Harris’ subsequent touchdown gave Oregon a response, but the Ducks could not build a run of unanswered scores. Ndukwe’s punt block helped Indiana stretch the lead again in the fourth quarter.
The final period reinforced the game’s central pattern: Indiana capitalized when Oregon gave it favorable field position.
What the Player Stats Show
Mendoza delivered the stronger quarterback performance through accuracy, touchdown production and ball security. Sarratt led Indiana’s receivers, Black supplied two rushing scores, and Ponds produced the opening play that immediately changed the scoreboard.
Oregon had meaningful individual production. Moore threw for 285 yards, Johnson led the game in receiving yards, and Hill recorded its longest run. Those contributions explain why the Ducks’ yardage total remained respectable.
But the most revealing figures were three turnovers committed by Oregon, none by Indiana, and five touchdown passes from Mendoza. Combined with a blocked punt and strong third-down execution, those numbers explain why Indiana’s 56–22 victory was far more decisive than the total-yardage comparison suggests.
Read more : Minnesota Vikings vs New York Giants Match Player Stats: Minnesota Wins 13–10